DEBUGGING INTEL XDK APP PROJECTS
Before reading this tutorial, please read the previous tutorial first, http://xdk-steps.blogspot.com/2014/11/how-to-test-intel-xdk-projects.html
The objective of debugging is to observe what happens internally when a project runs.
XDK projects can be configured to send internal messages to XDK IDE so that the developer would be able to learn more on the runtime behavior of the projects.
You have to install Intel App Preview into the mobile devices that you want to connect for debugging purpose.

STEPS
1) Create a Start Up project
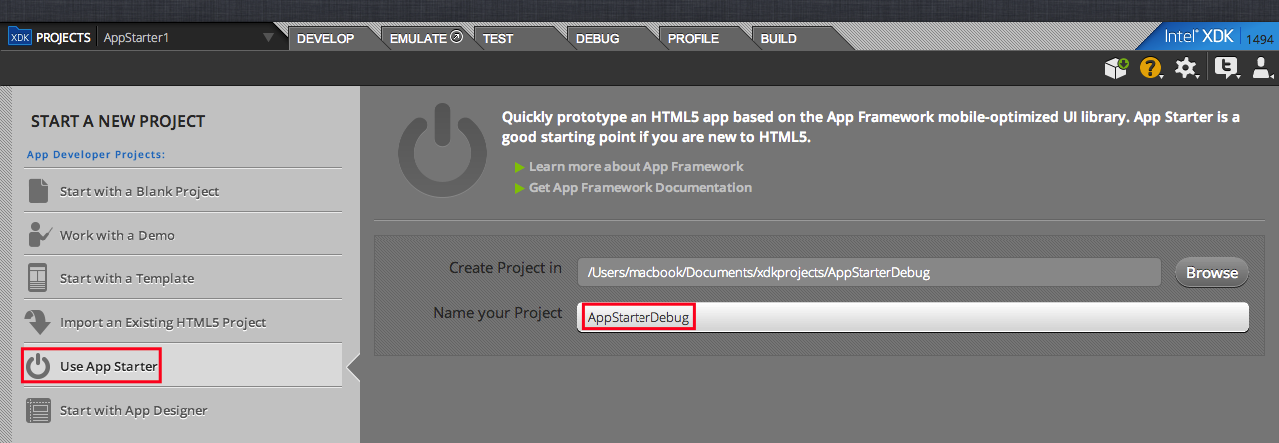
1.1) Create a new App Starter project
Select use App Starter
Enter a project name AppStarterDebug
You should get a Success Message.
2) Switch to Code mode.

3) Edit the codes
We are going to add some codes in between the lines 35 and 36 (function definition) and line 46 (function call).

function definition
<script> function testDebug(){console.log("This is Debug Message");}</script>
|
function call
<a class="button" onclick="testDebug()" style="" data-appbuilder-object="button">Hello World</a>
|

4) Connect Device to XDK
4.1) Connect your Android Device
Enable USB Debugging mode
4.2) Ensure that XDK detects your device.

4.3) Launch the test.

4.4) Wait for the app to appear in your mobile device.

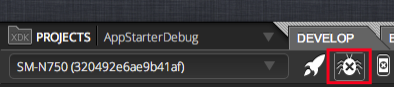
4.5) Click Debug button.
5) Debug
You can either tap the button in your Android Device or click the button in the Debug window.
Observe that when you click the button the message “This is Debug Message” appears in the console panel.
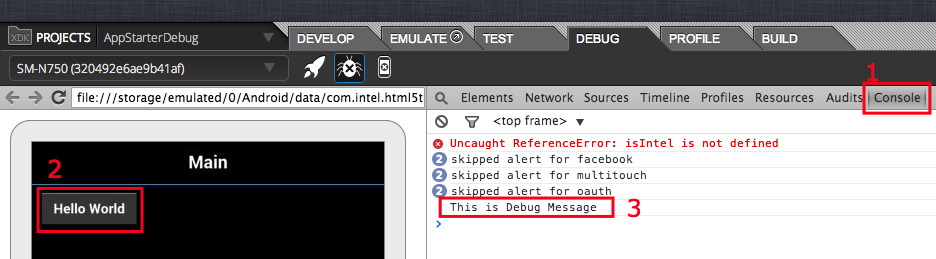
If you c lick more than once, the counter number appears besides the debug message.

No comments:
Post a Comment